Pre-legalization, Deloitte estimated that Canada’s legal cannabis industry would grow up to $4.34 billion in the first year of legalization, whereas StatsCan announced that $907.8 million of legal cannabis was sold between mid-October 2018 to September 2019. Deloitte had also estimated that the majority of purchases would be made through the legal market, but StatsCan data showed that the illicit market represented around 77% of all cannabis sales in the first year of legalization, which started to shrink in 2019 to a more even 53%/47% spread of illegal vs. legal.
Consumption Frequency in Canada
What’s the real story behind legal vs. illegal purchases and the effect on consumption? Using Cannatrack data collected between October 2018 and September 2019, it appears that trends in cannabis consumption frequency have begun to shift in Canada. Among cannabis consumers, people are shifting away from ’light’ consumption frequency (every two-three months or less) into medium (once per week to once per month) and heavy consumption frequency (more than once a week).

Now approximately 40% of consumers are light, 40% are medium, and around 20% are heavy users. These trends mean that these consumption frequency profiles in Canada are starting to mimic those in legal US states, making it a useful predictor of how the market might continue to change.
When looking at Canada vs. US markets, Canada has higher numbers of trial users and past four week consumption consumers than the US, even when compared to markets with long established legal recreational markets and readily available retail sales. In US legal states, 31.6% of respondents had never tried cannabis and 15.9% did not use it for more than a month, whereas Canadian data shows 33.3% and 18% respectively. This data challenges the notion that post-legalization markets see a boom in consumption from previous non-users. Cannabis 2.0 formats are much more widely available through legal channels in US states, but even this has not driven mass category adoption.
Using the example of Colorado’s legal market, and data collected over 13 months post-legalization, we can see more extremely light and extremely heavy consumers than Canada, which could be a predictor for where Canada is headed after a few years of legalization. Shifts in physical availability, increased medical use, and wider availability of formats may push Canadians’ cannabis consumption towards a higher frequency over time.
Who’s Buying Legal Cannabis?
It may be a surprise to hear that consumers under 40 are generally more likely to buy cannabis through legal channels, although nearly 50% of 18-year-olds report buying cannabis illegally—probably due to legal age restrictions being 19 or 21 in many provinces. Older age groups (making up about 46% of the market) tend to be more likely to report purchasing cannabis illegally. This is partially, but not fully explained by the proportion of older consumers living in rural areas where cannabis is more difficult to purchase legally.
What are People Buying Legally vs. Illegally?
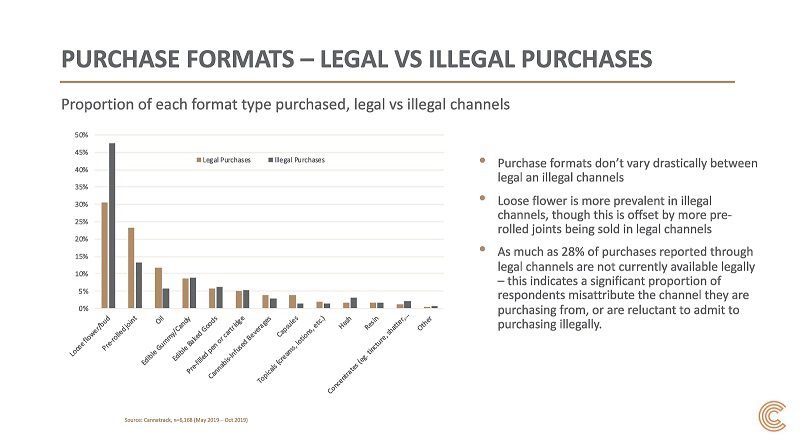
Looking at purchases made between May and October 2019, formats don’t vary drastically between legal and illegal channels. Loose flower is more prevalent in illegal channels, though this is offset by more pre-rolled joints being sold in legal channels. As much as 28% of purchases reported through legal channels are not currently available legally, which indicates a significant proportion of respondents misattribute the channel they are purchasing from, or are reluctant to admit to purchasing illegally.
How Much are People Spending?
On average, shoppers spend almost the same amount in legal vs. illegal channels ($83), with the $30-59 category being the most popular. However, consumers are less likely to spend small or very large amounts of money in legal channels. Black-market pricing is typically lower than legal markets, meaning shoppers of legal channels are purchasing more total volume of product per trip.
Why are People Purchasing?
Using data collected between May and October 2019, Cannatrack found that recreational use cases make up about 11% more of total purchases through illegal channels vs. legal channels. Therapeutic (medical without prescription) use cases make up almost 33% of purchases made through illegal channels. Within legal channels, 43% of sales are claimed to be for medical or therapeutic use.
Data from a November 2019 sample shows that black-market buyers claim to generally be less ‘influenced’ by almost all purchase drivers, except for ‘friend recommendation’. Price, potency, and format are dominant purchase drivers across the total market. Many of the same key factors influence channel choice among legal and illegal channel buyers. Convenience is the most often cited reason for choosing a purchase channel. Price and existing relationships are more substantial channel preference drivers among illegal buyers than legal buyers. Only 23% of buyers of legal channels cite being more comfortable purchasing through a legal source as a channel choice driver.
Trends suggest that Canada may follow the US legal model and see more consumers at the light and heavy ends of the consumption spectrum, with an uptick in legal sales based on proximity of stores to customers.