How do you measure success? In business, it is often measured by sales, but it is naive to think that sales alone are an indicator of a business’s prosperity. Companies use several metrics or key performance indicators (KPIs) to monitor their growth and profitability.
The Importance of Key Performance Indicators
Indicators can be classed as leading or lagging. Leading KPIs are forward-looking and highlight areas that need improvement, for example, customer retention. Lagging indicators report on results at a fixed moment in time and include indicators such as profit margins. These measures examine the health of a business and provide exclusive insights and market comparisons that help owners and investors make strategic, data-driven decisions.

How and What to Record
There are numerous performance indicators. Online KPI templates are available for self-measuring and programs can analyze financial data, POS analytics, and industry benchmarks. While companies track several KPIs, most analysts recommend owners limit their focus to ten measures that best determine if their company goals are being met.
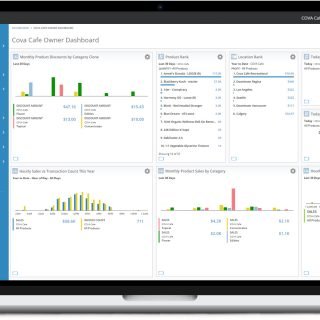
Cova Software provides cannabis retailers with a POS system, a customizable dashboard, automated compliance, robust reporting, and a centralized intelligence retail platform that easily integrates with other software and tools. Faai Steuer, vice-president of marketing at Cova, stresses the importance of recording data and measuring the right KPIs: “There are many metrics businesses should be monitoring, and it can become overwhelming. My advice is to start with the most critical metrics: sales, cost, inventory, and ultimately profit.”
“Owners should look at how much they sell per day, per employee, per square foot. What is their average basket size (sales/transaction)? When is the store busiest and when are transactions highest? They need to know what the best product mix is for them. What brings the most profit and traffic? Which product, supplier or category has the highest inventory turnover? The combination of these metrics can help them schedule staff, understand consumer behaviour, and stock the right products.”
Steuer goes on to say, “Tracking and monitoring inventory helps prevent out-of-stock items and enhances customer satisfaction. Knowing how much money is tied up in existing stock in a given period is critical because of the nature of the business. You need cash flow to purchase inventory, and the high value of cannabis products means stores need to purchase the right product mix to prevent the accumulation of low turnover items. When the pandemic hit, it took everyone by surprise. Sales skyrocketed for many companies, and real-time inventory tracking became crucial.”
Employees are often the single most significant expense in retail, and tracking their performance allows employers to identify their strongest performers and make strategic decisions regarding staffing.
Financial Performance Indicators
Financial KPIs provide different measurements of profitability. Operating profit margins measure profit after including various costs but before interest or tax. Earnings before interest, taxes, depreciation, and amortization (EBITDA) reflect the company’s overall profitability. This benchmark is used by investors to compare similar businesses exclusive of their accounting or financing decisions.
By combining POS metrics with financial numbers, data can be drilled down to highlight even more specific KPIs–like sales per square foot, expenses as a percentage of sales, and specific product profit margins. An analysis of sales per square foot is calculated by dividing net sales by sales space and can give insight into the importance of product placement.
Benchmarking Across the Industry
Some say, retail is retail; however, the cannabis sector cannot accurately be compared to ‘regular retail.’ From a business perspective, the two sectors have different valuations, growth drivers, margins, zoning restrictions, number of retail licences, and legislation governing their sales. Using regular retail markets as a benchmark is fallible. One needs only look at the recent economics of the COVID-19 pandemic, which saw increases in cannabis, liquor, and grocery retail sales but left clothing and other retailers in the dust.
With few provinces and companies making KPIs public, it isn’t easy to uncover these industry benchmarks. Headset partners with software companies like Cova and individual retailers to offer tools and preset reports on the industry. Store owners can use their business intelligence and benchmarking platform called Retailer Pulse, or choose to upgrade to Premium, which provides more advanced analytics and real-time industry data.
Phil McDonald, Headset’s director of regional strategy in Canada, says that in addition to focusing on finding revenue and managing costs, tracking your business with the market is a crucial indicator of performance. “How businesses interact with the market is very telling. A retailer can look at their data and say we grew by 5% this month. That is fantastic, but if the market grew by 8%, they didn’t catch all that growth. If they over-performed with 10% growth, then they captured more market share. These comparisons are important. Companies need to see if their sales are in line with the market. Are they hitting the benchmarks, and if not, why not? Is their pricing where it should be, or are they above or below the marketplace, and why? Market-driven information can lead a company to make better decisions on retail strategy.”
Monitoring your KPIs is more than just a sound business strategy; it will help you develop and monitor the progress of your initiatives in this unique industry.
How Delivery Impacted Sales in Ontario During the Pandemic
1. 65% of all Cova’s Ontario retailers use delivery
2. 30 of 46 locations actively make deliveries
3. Most are independents and not large chains/corporations
4. $60 increase in basket size for delivery orders
5. Average basket size for deliveries: $110 (Range $105 – $120)
6. Average basket size for instore: $50
7. Percentage of delivery vs. curbside orders
a. Around Toronto area and Ottawa: 35-40% delivery
b. Everywhere else in Ontario: 15-20 %
i. Outlier (Hobo): ~70% deliveries*
*Hobo opened up its first store in Timmins, Ontario, with record-breaking sales, even though it opened during a pandemic. The ability to deliver helped them achieve incredible sales records while still being able to safely social distance. Hobo sales on opening day – $45,891.11. Average sales on April 1st legalization day in Ontario (pre-pandemic) – $50,913.
Source: Cova Software