Since the end of March, extracts and edibles have been piquing the interest of COVID-era consumers. Sales data provided by Statistics Canada shows a sharp spike in the sales of cannabis extracts and edibles in April, and these categories have been growing steadily ever since.
July 2020 was no different. While the total number of packaged units of non-medical cannabis sold increased a healthy 11.5%, cannabis topicals shot up 21.5%, and cannabis edibles rose 16.8%.

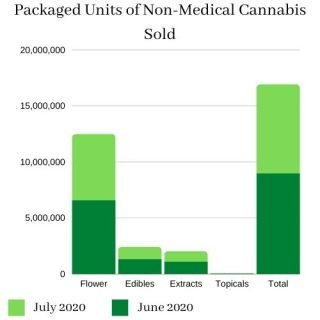
In total, 8,969,077 packaged units of non-medical cannabis were sold nationwide in July this year. As usual, the majority of those sales were dried cannabis, which made up 73% of the total sales. A total of 6,567,647 units of dried flower were sold, increasing 10.2% over June’s count of 5,895,382. A portion of flower customers must have switched to edibles because sales in July saw a 16.8% increase over June, selling approximately 300,000 more than the month before. Edibles now represent 14.6% of total sales, compared to 13.7%. Extracts saw a similar increase of 13.3%, breaking the million mark and selling 1,077,533 in July.
Cannabis topicals have the smallest share of total sales, accounting for 0.1%, which is not surprising since there were not many products in the market at that time. However, this category had the highest increase out of them all. In June, 7,874 of these products were sold, but in July that number rose to 10,030, showing a 21.5% increase.
The numbers may be small, but they show growing interest in a new and emerging category of Cannabis 3.0 products. As more products emerge on the market, customers are trying them out and showing that they are willing to try new things.
When it comes to inventory, there are over 45 million packaged units of cannabis waiting to be sold by cultivators, processors, distributors, and retailers. That’s approximately 4.7 times more than what was sold. The highest disparity in inventory versus sales shows up in cannabis extracts, where inventory is over 9 times higher than sales.
Market Share in July and Increase over June
73% – Dried cannabis +10.2%
14.6% – Edible Cannabis +16.8%
12% – Cannabis Extracts +13.3%
0.1% – Cannabis Topicals +21.5%
0.0002% – Plants 0%
0.03% – Seeds – 29.7%