Cannabis topicals are one of the newest categories to emerge on the Canadian landscape and have one of the smallest market shares, yet despite the occasional dip, its popularity continues to rise. As retailers and brands alike attempt to differentiate themselves from the competition with innovative products and customers discover these products, what could this category become?
Market Share
According to new data from Headset, topicals make up 0.64% of Canadian cannabis sales as of September 2021. It peaked for the year in August, still not quite reaching 1%, however, the graph below shows an interesting trend. In 2020, we see that popularity for topicals peaked in December, likely when customers were holiday shopping. They will have been getting educated by budtenders and other sources and learning who on their list may benefit from a nice bath soak or lotion. Sales dip in January along with everything else, but look what happens in February and March: sales increase as newly-converted topical lovers re-up their supply. This spike happens every couple of months or so, further confirming this theory.

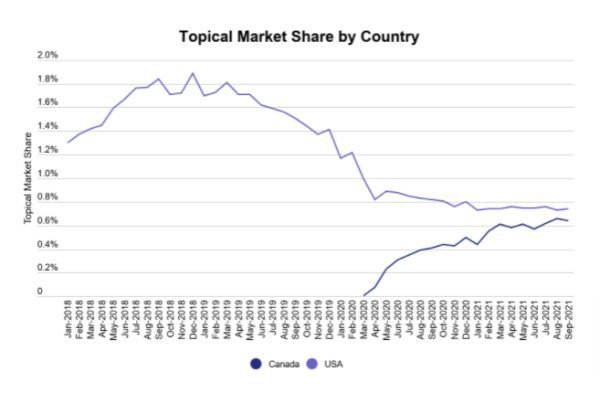
While growth is slow, Headset’s data shows that customers in this category are committed—these products work for them and they are now dedicated customers.
In the US, the popularity of topicals has levelled out at 0.8%, but if Canada continues its Christmas trend of converting new customers to topicals, which saw popularity north of the 49th parallel increase from around 0.4% to 0.6%, we could see topicals exceed that by next spring.
Types of Topicals
As of September 2021, the most popular category of topical was the ‘Lotions, Salves, Gels, and Creams’ category, making up 53.4% of sales, with Canadians’ second-favourite category ‘Bath Salts, Soaks, and Scrubs’ making up 19.9%, and transdermal products accounting for 21.9%.
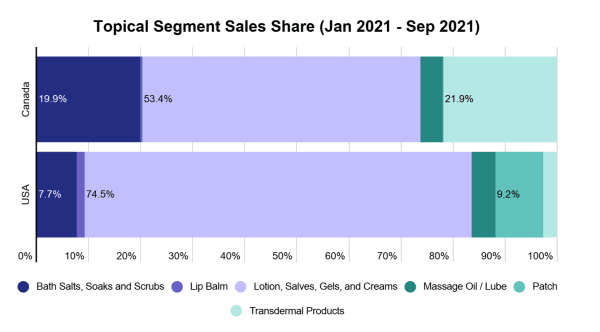
Product preference is slightly different south of the border. Only 7.7% of customers appreciated a good soak with the bath salts and soaks category, while nearly three-quarters (74.5%) of sales went to the lotions and salves category. In both countries, lip balms and massage oils came in last, likely due to a small selection of products for customers to choose from.
Anecdotally, balanced or CBD-only formulations work best for topical application, so it’s no surprise that products with no THC make up 29.4% of sales in this category. While the data provided doesn’t cover CBD, it shows that customers usually purchase products with 100 mg of THC (19.7%) or lower (27%), and only around 16% of customers purchased topicals with a potency higher than 100 mg of THC.
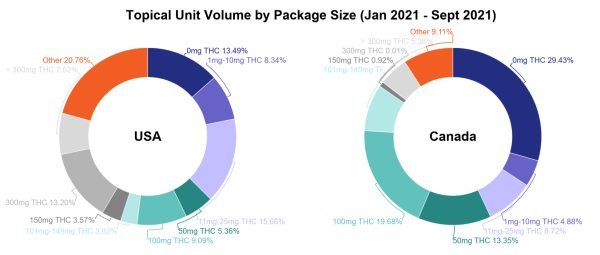
Customers in the US also seem to prefer more potent topicals, with 27.3% of sales going to products with over 100 mg of THC. Still, the majority of sales went to products with 100 mg of THC or less (38.45%, compared to Canada’s 46.7%) or no THC at all (13.5%).
Price
Price is where we see the hugest difference between the US and Canada. Topical prices in Canada are consistently at least $10 higher than in the US, and show much more fluctuation.
For instance, the graph below shows that prices in Canada started under $30 along with the US in April 2020, but by October of the same year Canadian prices had skyrocketed to $46 per item while US prices stayed around $26.
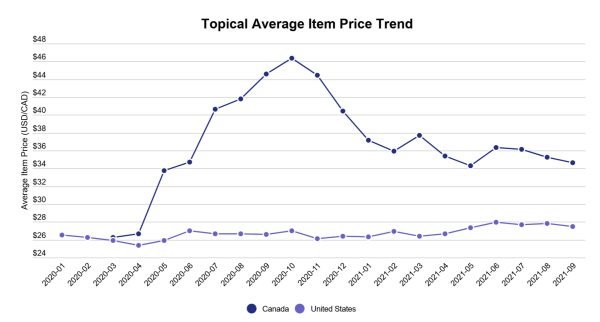
As of September 2021, Canadian prices have dipped to around $34 while US prices have reached $28, holding steady since the summer. Since topicals are a fairly new category, this fluctuation is normal as customers decide what they are willing to pay, and brands decide how much they need to get.
Although a small category, the popularity of cannabis topicals continues to grow. To really light a fire under this category, much more consumer education is needed.
Do sore construction workers know there’s a salve that may help their back? Do hairdressers know there is a lotion that may soothe their aching feet? Do those who suffer from acne realize that calming CBD skincare exists?
Customers in this category have shown they are die-hard when they find a product they like—they just have to know it’s there.