A new Headset report provides insight into sales growth, pricing, brand development, and product innovation within Canada since 2019. The report covers select cannabis markets in the United States and Canada (Alberta, British Columbia, Ontario, and Saskatchewan).
Sales Growth
There has been steady cannabis sales growth in Alberta, BC, Ontario, and Saskatchewan since 2019. Sales totals have grown 157% from May 2020 to May 2023. During this period, Ontario and BC saw triple-digit sales increases with 295.8% and 140% respectively. Saskatchewan (71.5%) and Alberta (62.6%) experienced a smaller increase, though still significant.

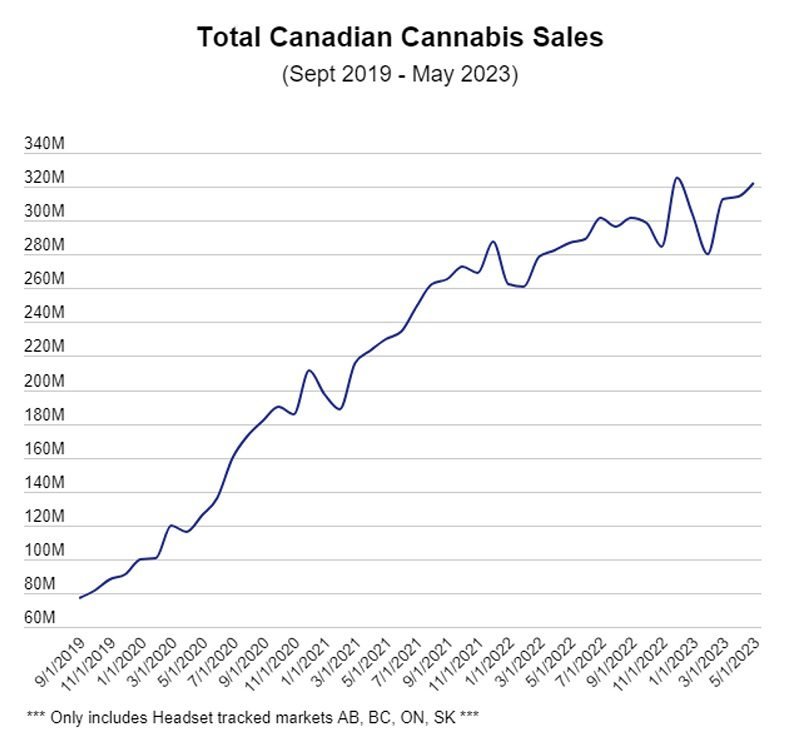
However, there are clear signs that growth is slowing. Between 2020 and 2021, Canadian sales grew 88.3%. Between 2022 and 2023 that number dropped to 11.8%.
A similar pattern is seen at the provincial level as shown in Figure Two. The pandemic also created an inflated demand for cannabis which was unrealistic to maintain as the industry returned to pre-pandemic market conditions.
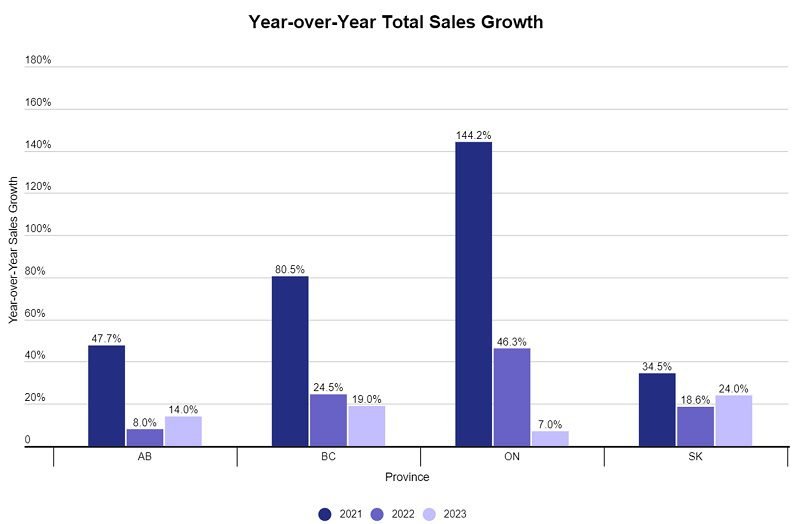 Ontario experienced a 144.2% increase in total sales between 2020 and 2021 but only grew by 7% from 2022 to 2023. Saskatchewan did not see fluctuations as dramatic with a 2020 to 2021 year-over-year sales growth of 34.5%. It had the highest total sales increase from 2022 to 2023 at 24%.
Store Count
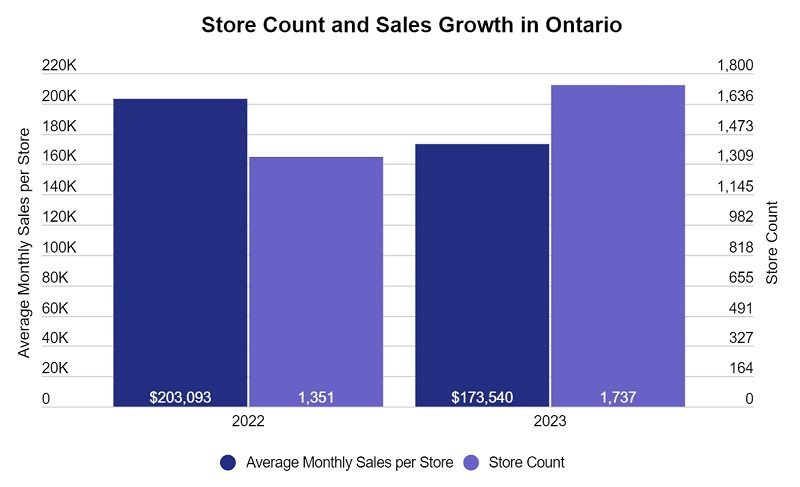
The data shows that much of the sales growth in these Canadian markets comes from store count growth versus growing demand.
As of June 2022, there were 1,351 cannabis retailers in Ontario, compared to 1,737 retailers that are currently authorized in the province. But between 2022 and 2023, average monthly total sales per store in Ontario dropped about 13% from $203,093 to $173,540.
 Brands Growth
 Brands Growth
The number of distinct brands in Canada has increased by 369% since 2020 to 769 brands in 2023. The rate of brand growth year-over-year may have slowed, but there was still a 27.1% increase in brands between 2022 and 2023.
Store count growth has increased but it doesn’t seem like sales for brands have. Between 2022 and 2023, the median total sales per brand dropped by 70%.
The total sales in the market have also become significantly more concentrated by a subset of top brands. In 2020, the top 21% of brands captured 80% of total sales. In 2023, 80% of total sales are captured by the top 12% of brands.
Pricing
The industry has faced pricing compression over the last few years. Figure Four shows the three-month rolling average of equivalized quantity (EQ) price. That is the price per unit of a product. For inhalables, that is the price per gram versus the price per mg for non-inhalables.
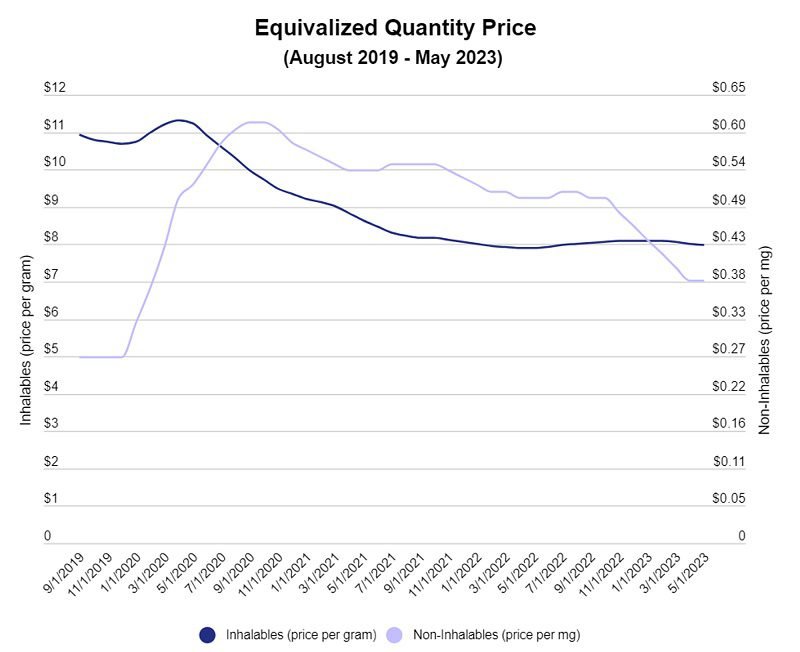
Prices in both product categories have fallen since legalization. EQ price for inhalables, which includes products such as flower, concentrates, pre-rolls, and vapour pens, decreased by 23% between May 2020 and May 2021. However, the following year, the decrease shrunk to only 8.6% and stabilized at the start of 2022 at around $8.00 per gram.
EQ prices for non-inhalables, which includes products such as beverages, topicals, edibles, capsules, tinctures, and sublinguals, initially increased as a result of Cannabis 2.0, but decreased over the following years. As of May 2023, EQ price for non-inhalables dropped 23.5% compared to the previous year.
Headset suggests that consumer preference towards higher THC limits in edible packages has heavily influenced an EQ price drop of 25.3% for non-inhalables in the last year.
Basket Analysis
Falling prices are impacting brands and retailers. In the last two years, the average basket size has decreased by 15.6% while the amount of products per basket has dropped by 5.1%.
Product Category
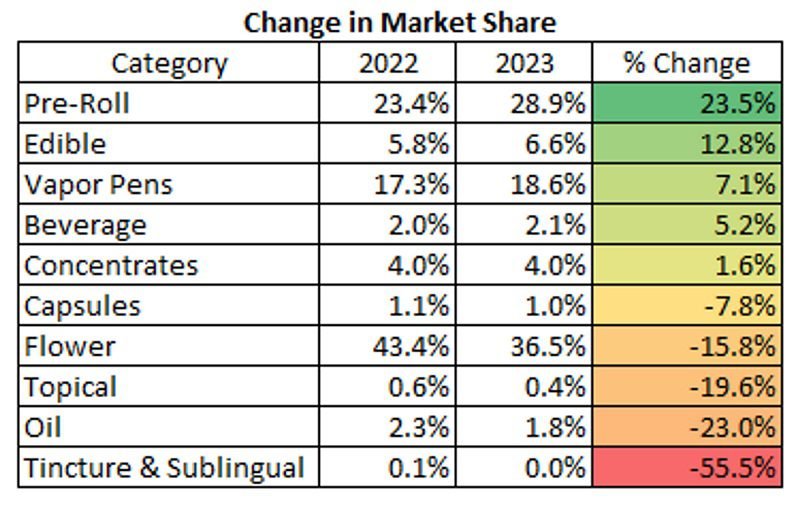
Flower is no longer the dominant product category as its share of total sales decreased 15.8% in the last year to nearly a third of all sales. Pre-roll products have grown their share by 23.5% in the same period to bring the category to near parity with flower.
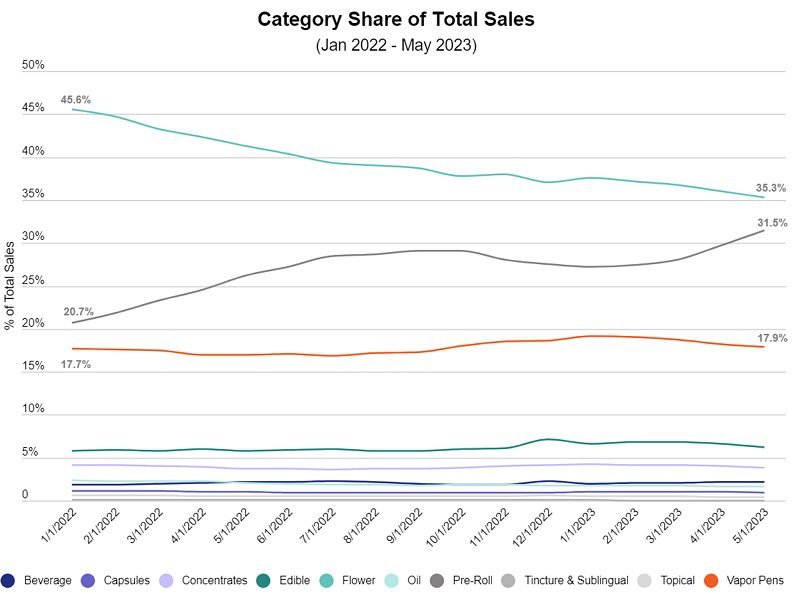
As shown in Figure Six, edibles, vapour pens, beverages, and concentrates have all seen various levels of growth in market share as well. Wellness products such as capsules, topicals, oils, tinctures, and sublinguals have continued to lose the little market share they previously possessed, while the percentage of total sales captured by flower has decreased by 15.8% from 2022 to 2023.
Infused pre-rolls and other high-value products (THC per dollar) are gaining popularity, as are terpene-forward concentrates and vapor pen cartridges.