The price of cannabis continues to drop in BC as inhalable extracts overtake flower sales according to the latest BC Cannabis Wholesale Quarterly Sales Report for Q2 2023 (July, August, and September).
Report Highlights
In Q2, wholesale sales were up 24.3% to $137,126,174 from $110,290,429 in Q2 2022 with 40.9% more wholesale grams of cannabis sold compared to the prior year.

Cannabis prices continue to drop in the province. In Q2, the price of all cannabis dropped by 11.7% to $4.05 per gram compared to $4.59 per gram in the previous year. Similarly, the price of dried flower dropped 11.1% to $3.33 per gram compared to $3.75 per gram in Q2 2022.
Retail store growth was up in BC with 490 stores in 2023 compared to 452 stores in 2022. This includes public and private retail stores.
But store growth has slowed over the past several quarters. In Q4 2022/23, sales growth was up 15.44% and in Q1 2023 it grew 10.2%. This past quarter, it increased 8.4%.
Dried Flower Sales Trends
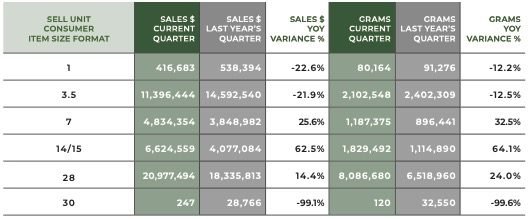
3.5-gram and 28-gram SKUs dominated dried flower sales but sales in the 3.5-gram category were down from the prior year. 3.5 gram SKU sales were $11,396,444 in Q2 2023, down 21.9% from 2022. Comparatively, 28-gram SKU sales were $20,977,494, up 14.4% from the previous year.
14-15 gram SKUs saw a notable increase in sales this quarter up 62.5% from the prior year to $6,624,559. 30-gram SKUs saw a drastic change with sales down 99.1% compared to Q2 2022.
Product Category Sales
Inhalable extracts overtook flower sales this quarter with each category hitting $46,120,036 and $44,249,780, respectively. Inhalable extracts sales started to creep above flower sales last quarter.
Most categories saw an increase in sales from the previous year’s quarter. Inhalable extracts sales were up 57.8%, beverage sales increased 40.2%, topicals sales were up 26.3%, pre-roll sales rose 19.5%, and edibles sales were up 17.3%.
Seed sales were, however, down 25.4%. This category has been consistently dropping over the last several quarters.
Sales Mix by Product Category
Carbonated drinks dominated beverage sales at 84.9% followed by non-carbonated drinks at 13.7%. In Q2 2023, dry tea and coffee sales were up 439.4% from the prior year, while carbonated drink sales were up 38.6%.
Chews dominated edible sales at 92.6% followed by chocolate at 5.8%. Baked goods sales were up 36.6% from the prior quarter, while hard candy and other edibles saw drops of 100.0% and 66.5% respectively.
Flower and ingestible extracts sales saw more even splits. Indica represented 47.2% of sales in Q2 2023 followed by Sativa at 31.8% and Hybrid at 20.5%. In the ingestible extracts category, capsules and pills took 48.9% of sales followed by oils and tinctures at 48.3%.
Cartridges and other inhalable extracts had the strongest sales in the inhalable extracts category at 48.5% and 38.4%, respectively. Creams and lotions dominated the topical sales category at 50.1% followed by balms at 36.4% and bath products at 11.9%.
Direct Delivery Program Sales
The report also includes sales from the LDB’s Direct Delivery Program, which launched in August 2022 and continues to grow.
There were 821,718 grams of cannabis sold through direct delivery in Q2 totaling $3,777,539 Comparatively, last quarter 779,775 grams of cannabis was sold.
The average price per gram for all cannabis was $4.60, while the price per gram for flower was $4.00. Similar to the price of cannabis not sold through direct delivery, this has dropped over the last several quarters.